Fracture Notes - In progress
What are cracks and fractures? How does hydraulic fracturing work? How does HF relate to sheeted clastic dikes?
In this post, I reveal the process of drafting figures for future publication that explain fluid-driven fractures and crack propagation relevant to sheeted clastic dikes in the Columbia Basin, USA. These concepts (fracture mechanics)are common to engineers and petroleum geologists, but foreign to most geology majors and their professors. These concepts are not taught at most colleges in the PNW, but could be. It is not an exhaustive treatment of the subject by any means. My goal is to build a library of sketches that bridge the gap to geologists. This is a holding place for draft versions of my technical artwork.
Don't steal my stuff.
............................................................
Stuff to do...
Principal stresses...........
Blades, wings, and apertures...........
Crack tip theory........
K, Kt, KIc........
Fracture patterns in plan view and cross section.........
Irregular fracture fronts in outcrop........
PKN, KGD, penny, t-shaped.......
Polygonal patterns in 2D and 3D.........
Vertical crack propagation/reactivation in stacked sediments.........
Cyclic deformation and fatigue........
DFIT test curve........
Skin factor and silt skins.....
Nearfield and farfield hydrofracture.......
Propped fractures both induced and natural.......
Hall plots and sheeted dike structure....
................................................................................................
Fractures. When we talk about fractures, we're talking about stresses, materials, and the response of different types of materials to different magnitudes and orientations of stresses.

Materials have flaws. No material is perfect. All materials - metal, wood, rock, polymers, ceramics - contain flaws (cracks, notches, holes, etc.). Small flaws can grow into larger fractures. For our purposes, flaws are microscopic cracks (i.e., the scale of grain boundaries in a sandstone or granite) and fractures are things you can see with your eye. Most flaws go undetected, don't grow significantly over time, and don't threaten the integrity of the material. Fractures, if large enough, can lead to material failure.

Positive and negative pressure along a crack. Here's a different way to visualize stress along a crack. Instead of using arrows to show principal stress orientations of the material, I put arrows on the crack. So, stress from the crack's perspective. I'm trying to illustrate the competition between stress inside the crack (positive, arrows pointing up) with that of the material, which is trying to close it (negative, arrows pointing down). The closure pressure, or the material's resistance to opening, is equal to the minimum principal stress (O3) because a tension crack will open against O3 in the O1-O2 plane. In an open crack Pf > O3. Figure A shows how it is possible for different parts of the same crack to feel positive and negative pressure. Figure B takes the concept a bit further. The solid line represents a visible crack or flaw (positive pressure). The dashed lines represent incipient cracks, or microfractured region lying just beyond the crack tip (negative pressure). Figure C shows an open crack and incipient cracks beyond the crack tip. The open crack has positive pressure because it is pushing outward against the material that surrounds it (against O3). Incipient cracks are not technically part of the crack; the crack tip marks the boundary between crack and the microcrack region. Incipient cracks must be closed due to negative pressure. Important to note the terms "stress" and "pressure" are sometimes used interchangeably, but that's not entirely correct. We use "stress" (units = MPa) for dry materials and "pressure" where pore fluids are involved (i.e, wet, porous material and hydraulic fracture, units = psi). Fracturing in geologic materials - as opposed to engineered foundations or steel structures - is almost always is hydraulic fracturing.

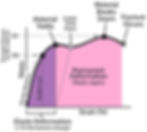
Stress and strain. A stressed object will bend before it breaks. Rocks, wood, steel, plastics, and ceramics all behave in this manner. If the amount of applied stress remains below the material's elastic limit (linear part of curve), only bending will occur and the object will resume its original shape once the stress is removed. If the stress exceeds the material's elastic limit (its yield strength), permanent deformation (strain) occurs from which the material cannot fully recover. Its shape is permanently changed (non-linear region). Wherever along the curve fracture occurs (failure occurs), drop a line straight down to the x-axis to find the corresponding strain, or amount of deformation expressed as a percent.

Four curves describe different material response (strain) to applied stress. Examples from left to right: Engineered monolithic ceramic (very stiff, small toughness), Concrete or glass, Most metals/alloys/many rocks (large toughness, strain hardening, energy absorption), A polymer like UHMW polyethylene.

Brittle and ductile fracture. If a stressed material breaks at point B, it is a brittle material that has undergone brittle fracture (failure) at a relatively low strain amount corresponding to point C on the x-axis. An example of a brittle material is blackboard chalk. If a material breaks at point B', it stretched a bit before breaking. It is a ductile material with a failure point at B' corresponding to relatively high strain at point C'. An example of a ductile material would be steel rod.
Another look at a stress strain curve for a ductile material. The curve wanders a bit. Young's modulus (E, or stiffness) is the slope of the line that approximates the linear elastic portion of the curve. With added stress, the material deforms (absorbs energy = changes shape = strains).


Strain energy, resilience, toughness. The area under the curve is energy. If the strain remains elastic, energy is absorbed (bending not breaking, returns to shape). If permanent deformation occurs (stressed beyond yield strength), energy has been expended on the material during deformation and dissipated.

Failure. What do we mean by failure? A fracture is a break in some material, which is certainly a permanent type of deformation, but not all fracture constitutes failure. The term "failure" is something humans define, typically for a structure built to do a specific job. While a material in one part of a structure may be said to have failed along a fracture, the entire structure, composed of several parts, may remain standing and acceptably functional - even safe. Looking at it another way, an unfractured material can be said to have failed even if no fracturing occurs. A chair made entirely of soft rubber will fail to serve its structural purpose (supporting you), but snap back into shape after it dumps you on the floor. Another example might be small cracks around rivets in an aluminum wing of an airplane. Cracks will grow around rivet holes very slowly over the working life of the aircraft, but by design, may never reach a critical length that would cause the wing structure fail (or be considered by humans to be a failed wing). The cracks, which may remain microscopic, may never threaten passenger safety for the life of the aircraft. A fully functional wing will contain flaws (small cracks), yet perform its job just fine for decades.
Photo credit: peteradamsphoto.com

Shapes of fractures in 2D and 3D. Its easy to draw fractures in 2D, but its important to understand fracture geometry in 3D because fractures propagate along curved fronts. In the 2D drawing, the fracture tip - the forwardmost part of propagation - can be drawn as a point. In the 3D view, however, we see the fracture front is not a point at all, but a curved line. The fracture front is an arris formed by the intersection of two planes or two slightly curved surfaces. For this reason, the "fracture front" is sometimes called the "tip-line".

Fracture opening modes. Mode I: Horizontal tension creates a vertical fracture. Mode II: Sliding in the vertical plane. Mode III: Out-of-plane shear (tearing). We will focus mostly on Mode I, tensile opening. Clastic dike geometries indicate Mode I failure is by far most common in the Columbia Basin.

Bending? Another way to create fractures that taper upward, downward, or in both directions is by bending. Tension cracks open at the crest of the bend. Alternating loading and unloading would theoretically do this (rapid flooding/loading, rapid draining/unloading). If clastic dikes open at the top and bottom, then this might be one way to explain it. The problem is that dike fills in the Columbia Basin are not sourced at depth.

Rapid loading and hydrofracture. Fluid pressure inside a crack increases in response to rapid deposition of a thick slug of sediment or by a deep flood. The key ingredient is the seal. If the substrate is a low permeability material, it can create the seal. In unconsolidated sediment (high porosity, high permeability) the seal must form during loading event. As pressurized fluid enters the fracture, some of it will leak out through the crack wall into the surrounding sediment. The exiting fluid drags fine particles with it toward the wall where they accumulate as a low-permeability skin (filter cake) sealing the fracture.

Parts of a fluid-driven fracture (hydraulic fracture). Fluid-driven fractures are common in geological materials. By dissecting a crack, we see how its various parts relate to the process of crack propagation and filling (i.e., hydrofracture and clastic dike formation). Modified from Phillips et al. (2013).

Sharp cracks and blunt cracks. Stress at a the tip of a blunt crack is distributed over more surface area than a sharp crack. Consider an oval-shaped crack. We can depict the sharpness of its tip with a circle. We're zoomed in to a coarse microscopic scale - near the limit of what the human eye can resolve. Small radius circle = sharp crack. Large radius circle = less sharp. So that's crack sharpness. The next idea involves what happens at the tip of a crack as it begins to propagate. Crack propagation means the tip advances forward through the material. Because the region just beyond the tip experiences ductile deformation (think: Poisson's ratio and the shape a squashed/stretched material assumes), an initially sharp crack will begin to blunt a bit. A blunt-tipped crack can be depicted with two points, now spaced slightly apart. The two points describe a larger radius of curvature at the crack tip.

Maximum stress at crack tip. Whether sharp or blunt, stress is concentrated at the crack tip. The material is in tension. Maximum principal stress (O1) is oriented vertically. Minimum principal stress is horizontal (O3, arrows).

Stress increases near hole. Stresses will rise considerably as you approach a hole in a plate under stress (stress field = Sinf). Stress is 3 times greater within 1 radius distance from the edge of the hole than the stress field in general. But at a distance of 2 radii, stress is indistinguishable from the background. This non-linear stress-distance idea is similar to what goes on at a crack tip.

Hydraulic fractures in vertical and horizontal wellbores. Fracking is done to stimulate tight gas reservoir rocks. Fractures greatly increase the effective surface area of the wellbore, making gas/oil more available for pumping. A wellbore with a very large circumference would accomplish the same thing, but wide bores are not technically feasible or desirable for safety reasons. It works like this: A well is drilled and cased (pipe, cement). The case is perforated through one or more target zones. A targeted portion of the wellbore is shut in, fluids are pumped in, and the pressure inside the shut-in portion jacked way up using pumps. The point at which fluid pressure reaches the minimum confining pressure (O3) of the rock, fractures will begin to propagate. Fractures initiate from the perforations and advance outward into the formation. Fractures rapidly fill with the fracking fluid (water + sand + chemicals) and be propped open by the sand. Propped fractures will flow gas and oil back to the wellbore when pumping begins. in the figure above, horizontal fractures extend from the vertical wellbore. Vertical fractures extend from the horizontal wellbore. But fracture orientation and wellbore engineering is far more complicated than this.

Irregular fracture fronts. Let's examine the shape of a fracture front (tip-line) as it advances. Each "contour" in the figure above represents the position of the fracture front at a moment in time. Modified from Beilin and Carey (1997). A few observations:
a.) The fracture front in this example is irregular, with two distinct lobes (A and B).
b.) Rate of advance through the material is not constant for all parts of the fracture front. The rate of advance for lobe A shows a decelerating pattern through time, while the advance of lobe B remains fairly constant.
c.) The front becomes more irregular with distance and time.
d.) The 3D shape of an irregular fracture front will look different when intersected by a plane orthogonal to it (plane = face of outcrop). We'll come back to this later.

Fracture propagation in steps. End view and profile views of an advancing fracture tip-line. Context here is an induced fracture propagating from a vertical well bore, but the concept applies to natural fractures. The fracture aperture increases slightly over time (widening).

irregular fracture front. Time steps show a growing fracture, the advance of its tip-line, and how its final geometry expresses as projections on faces of a cube. Cube faces represent vertical and horizontal faces of outcrops. What we see in outcrop may only tell part of the story about the fracture's 3D geometry.

Cross sections through an irregularly-shaped fracture. Cross sections (A-A', B-B', C-C') through a wedge-shaped fracture with an irregular front will appear quite different from one another depending on where the intersecting plane (outcrop) it is located. 2D shapes may lead you to conclude taper direction (infill direction) is one way, when in reality it might be just the opposite. Outcrops, for the most part, are random slices (planes) through the geology. Make sure to do a little digging in order to determine true taper direction of filled fractures if you suspect curved or irregular fronts (which you should).

En echelon vs. straight. Fractures that appear separated can merge in the third dimension. Consider a fracture in the shape of a slightly inflated disc. Plane A intersects one part, Plane B intersects another. The expressions of the fractures are very different. The planes represent the outcrop. Plane A shows Mode III failure (out-of-plane tearing) and Plane B shows Mode I failure (tensile opening), but its the same fracture.

Nearfield and farfield deformation. Formation of sheeted clastic dikes in the Touchet Beds of WA-OR-ID appears to have involved two different scales of stress and strain. Vertical dikes form in thick, laterally extensive bodies of sediment. On one hand, free face edge effects (i.e., toppling of bluffs, lateral spreading) in thick layers are not significant in sheeted dike injection. If there's any question, consider the huge networks of very wide, sheeted dikes in the center of Pasco Basin where there were never free face bluffs. But edges may be important in other ways (pressure shadows and fracture toughness in thin vs. thick materials). More on that later. Dikes in the Touchet Beds resulted from elevated pore fluid pressures, partially-sealed cracks, and fluid-driven fracture (internal phenomena). They are not gravity driven tension cracks formed by lateral spreading (free face extension) or toppling of vertical streambanks. The vertical loading and the hydraulic fracture model best fits observed dike geometries, crosscutting relationship, and stratification in sedimentary fills. More on nearfield and farfield stresses below.

Far field hydrofracture. A single curve is typically used to represent the initiation, propagation/infilling, closing, and post-closure leak-off of a hydraulic fracture. But two different scales of fracture at play, near field and farfield. A single curve does not capture this.
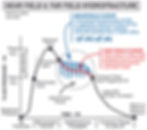
Hydrofracture at two scales explains sheeted clastic dike formation in the Touchet Beds. I think sheeted clastic dikes in megaflood deposits form by hydraulic fracture where the pressure fluctuates during the propagation phase. As one fracture opens, propagates, fills, and closes a new, adjacent fracture initiate, repeating the cycle. This describes the near field scale. Several parallel fractures form adjacent to one another during a brief loading event. The far field scale isn't concerned with the fractures at all, but with the overall load on the body of sediment (the vertical load applied to the sedimentary substrate which triggers hydrofracture at the local, near field scale. Loading is the trigger). Loading is constant and sustained through a period of time when fractures form, consistent with how you would expect loading by megaflood to proceed (imagine the shape of a flood hydrograph but replace discharge with weight). Near field pressures fluctuate above and below the O3 line (fracture initiation/closure threshold). Each time the blue curve dips below the O3 line, the open crack that is being filled closes. Each time pressure rises above the O3 line, a new crack opens (usually, but not always; see next figure). Silt skin thickening coincides with leak-off, which actually begins when a fracture first opens and proceeds until equilibrium returns (both pressure and capillarity). My diagram suggests leak-off begins once a fracture closes, but this is wrong. The volume-pressure relationship (an inverse relationship) inside a growing and filling fracture is also relevant. As a fluid-driven crack grows, so does its volume. At some point the crack's internal volume is too large to maintain the fluid pressure level above the O3 threshold, so it must close. Sediment entering the crack effectively reduces the volume, but I don't think it can mitigate the internal pressure drop altogether - just delays the inevitable(?). Summing up: Constant loading (pore fluid pressure elevation) at the far field scale and cyclic behavior at the near field scale (repeated cracking and filling). Sheeting in a single dike (the development of compound structure) can develop during a single loading event. New dikes formed during later flood events exploit the weakness pathways of older dikes. The result is wide dikes with complex histories (composite structures). Many of the very wide, sheeted dikes in the Touchet Beds are compound, composite structures.

How sheeting develops during a single diking event. Time steps illustrate how crack tips propagate, how cracks fill with sediment, and how volume and fluid pressure changes inside fractures during a single event (flood loading event). Field observations confirm that packages of sheets can form during a single event. I use the term "nearfield" to describe dynamics at the scale of the fracture. "Farfield" refers to the stress (loading) felt by the surrounding body of sediment, described by a smooth fluid pressure-time curve shown in other figures.

Failure to fracture. Fractures propagate when the fluid pressure inside exceeds the confining pressure of the surrounding formation (Pf > O3). A fracture cannot open if the minimum principal stress (confining pressure, O3) is not exceeded. The red curve describes a crack that cannot grow (Pf < O3).

Formation of sheeted dike fills. Sheeting forms in response to near field fluid pressure fluctuations (pressure pulses) during fracture propagation. A single flood event can produces packages of sheets. Multiple flood-load events produce composite clastic dikes.

Silt skins and slurry wall filter cake. In heavy construction, foundations are sometimes build below ground. We're talking foundations for big buildings here. A deep trench is excavated using a deep-reach bucket or other special equipment. A cage of rebar is lowered into the trench and the trench is filled to the top with a concrete slurry. Water diffuses out of the concrete slurry into the soil walls, rapidly at first (minutes to hours), leaving behind a filter cake lining composed of fine grained material which sort of seals the trench. In a hydraulic fracture parlance, this diffusion is called "leak-off" and the filter cake is called a "silt skin". In a Touchet type clastic dike, water exits out of the slurry fill, dragging fine particles with it that get screened out at the dike wall.

Relative permeability of reservoir rocks and everyday materials. Conventional reservoirs contain high permeability rocks, commonly sandstones, which will generally flow under pumping alone and require little in the way of stimulation in order to produce gas and oil economically (conventional = uncomplicated). Unconventional reservoirs, usually tight shales, require up-front work in order to ensure hydrocarbons flow to the wellbore fast enough to justify the expense of drilling. Fracking is used where the combined fluid flow rate through the pore space and fracture networks is too slow for economic production. Engineered (induced) hydraulic fracturing of low-flow zones (fracking) is often employed after drilling to stimulate target horizons within tight formations. Hydraulic fractures extend far beyond the wellbore and greatly increasing the effective surface area of the wellbore (i.e., volume of the straw). Proppant holds fractures open preserving their ability to convey hydrocarbons. Without proppant, most fractures would close under the hydrostatic load once a fracking session ends. Hydraulic fractures propagated from the wellbore serve as fast(er) conduits for moving hydrocarbons out of pore spaces in the rock to tanks and pipelines at the surface.

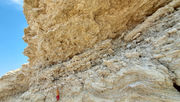
Dike-sill-dike geometry. Grainsize and the orientation of principal stresses controls fracture propagation in sediment and the geometry of clastic dikes in the Columbia Basin, WA-OR-ID. This stair-stepping dike has an overall wedge shape (tapers downward) at the scale of the outcrop near Lewiston, ID (see figure below). This dike propagated from left to right and terminates in a high-porosity boulder gravel (Bonneville flood) that underlies Touchet Beds (Missoula floods). Zooming in, we see its width thins through the horizontal sill segment though the number of fill bands remains the same. That cannot happen without significantly elevated pore fluid pressures. Pore fluid pressure in the dike segment opens against the least principle stress (O3, horizontal). Fluid pressure in the sill segment opens against the maximum principal stress, therefore must equal or exceed the vertical weight of the sediment above plus weight of the pore water and the column of floodwater (O1, vertical). But since its the same fracture whether dike or sill, the same fluid pressure applies to both (though pressure reduces along its length, shown as R --> r). We can explain the width difference can be explained with an efficiency factor (R, r) corresponding with coarse grained layer (higher porous, permeability) followed by the sill segment. Fluid pressure that opened this dike, and most others in megaflood sediments, just barely exceeded confining pressures. See photo and figure below.
Lewiston dike. Grainsize (porosity, permeability) determines dike or sill geometry. Sands tend not to fracture when stressed and accomodate pressurized fluid flow in their pore space network (matrix flow not fracture flow = sills). Silts tend to fracture and accomodate fluid flow in fractures (fracture flow not matrix flow = dikes). Photo from Lewiston, ID.

Lewiston dike measurements. This is same dike shown in photo above. Lewiston, ID.

Sand injectites. About 20 years ago, oil companies began discovering huge sand-filled fracture networks formed by hydraulic injection in fine grained sediments of deep marine basins around the world. A sand injectite is commonly part of turbidite fan-lobe complex formed at the base of the continental slope. Many are large enough to be seen in seismic images. Injectites are porous sand bodies surrounded by impermeable mudstone - near perfect reservoirs targeted for drilling in places like the North Sea. The sand originates from the continental shelf (where we expect sand to be). The mud into which sand is injected was deposited on the abyssal plain (also where it should be). Narrow canyons rapidly deliver sand from the shelf to the muddy seafloor. Voluminous sand bodies residing on the seafloor was not something predicted by sequence stratigraphy just a few decades ago, but the secret is out now. Anomalous sand dike-sill complexes that geologists encountered 100 years ago in outcrops (i.e., Panoche Hills, CA), but didn't fully understand, are today recognized for what they are: injectites. Industry researchers and academics like Andrew Hurst at University of Aberdeen have greatly improved our understanding of sand injectites in recent years. Figure modified from Cobain et al. (2016).

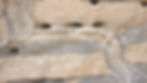
Spurs define fluid pressure gradient. Downward and horizontal injection in a clastic dike at Latah Creek, WA mimic the geometry of injectites in petroleum basins. The two spurs pioneer new routes through the host sediment, but follow paths identical to the larger, stair-stepping dike above, from which they branch. Photo is 50cm across.
Early work on sand injectites. Early mentions of large-scale sand dike-sill networks now recognized as injectite complexes were made by Muchison (1827), Gottis (1953), Rutten and Schonberger (1957), Truswell (1972), and Hiscott (1979). Seismic surveys have imaged the precise 3D architecture of injectite networks (Timbrell, 1993; MacLeod et al., 1999; Lonergan et al., 2000; Molyneux et al., 2002; Huuse and Mickelson, 2004; Huuse et al., 2004, 2007; De Boer et al., 2007; Jackson, 2007, 2011; Szarawarska et al., 2010; Cobain et al., 2016). In a few truly remarkable locations, injectite networks are revealed in outcrop (Surlyk and Noe-Nygaard, 2001; Fries and Parize, 2003; Hubbard et al., 2007; Vetel and Cartwright, 2009; Kane, 2010; Monnier et al., 2015). Downward and lateral propagation of sand injectites has been discussed by several authors (Gottis, 1953; Rutten and Schonberger, 1957; Beaudoin and Fries, 1982; Beaudoin et al., 1985a,b; Parize, 1988; Huang, 1988; Parize and Fries, 2003; Parize et al., 2007a,b; Scholz, 2009, 2010). Propagation in all directions is also recognized (Philips and Alsop, 2000; Surlyk, 2001, 2007; Rowe et al., 2002; Ribeiro et Terrinha, 2007). In most known injectite complexes, however, fractures propagate primarily upward and laterally from sources located at deeper levels (Smyers and Peterson, 1971; Truswell, 1972; Hiscott, 1979; Hillier and Cosgrove, 2002; Huuse et al., 2004; Hubbard et al., 2007; Cartwright et al., 2008; Monnier et al., 2014).

Grippa. A beautifully drawn example of sand injectite fracture network geometry from Grippa et al. (2019). Note the 2D vs. 3D geometries. Does this figure change your concept of what fracture networks look like and how fractures intersect?

Monnier. A stylized rendering of sand injectite fracture network geometries in the Vocantian Basin from Monnier et al. (2015). Fracture wings extend from the same source, turbidite channel (narrow, voluminous sand bodies). How are the principal stresses oriented for each fracture network (LePuy, LeCouvent, La Beaume, Vieux-Bevons, Les Houlettes)?

Reinjection of fractures. Repeated deposition of sediment by large floods, repeated fracture widening, and development of sheeted fills. Each new crack and fill episode begins with a slightly new stress condition. Modified from LeHeron and Etienne (2005).