Ngram and the High Himalaya
The two images below were created from datasets entirely unrelated to each other, yet result in strikingly similar curves. The first is an elevation profile of the Himalayan Mountains, plotted from topographic contours. Elevation is on the y-axis and distance on the x-axis. The second image charts the usage of the word "Himalaya" in books and articles published between the year 1800 and 2000 (Google Books Ngram Viewer). Frequency is on the y-axis and time is on the x-axis. I added the labels to both ("High Himalaya" and "Tibetan Plateau"). Pretty cool, huh?

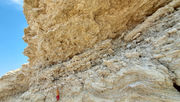
Topographic Profile of the Himalayas.

Usage of the term "Himalaya" in books from the year 1800 to 2000.